Palak Agarwal

Geospatial Data Scientist
University of Pennsylvania
Master of Landscape Architecture
Master of Urban Spatial Analytics
Landscape and urban designer bitten by the data bug.
View My LinkedIn Profile
Portfolio
Projects
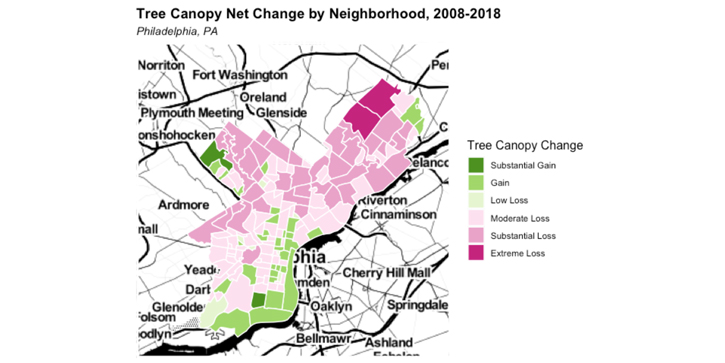
Canopy View - Saving tomorrows tree canopy today
Tree canopy is defined as an area of land which, viewed from a bird’s eye view, is covered by trees. Trees offer essential benefits to cities, including mitigating the urban heat island effect, absorbing stormwater runoff, a habitat for wildlife, aesthetics, and recreation. A 2020 study published in The Lancet found that if Philadelphia reaches 30% tree canopy in all of its neighborhoods, the city would see 403 fewer premature deaths per year. Most of the tree canopy loss occurred in historically disenfranchised communities. In response, the City of Philadelphia has set essential milestones for conserving and increasing the current tree canopy in the city. In this analysis, we model tree canopy loss in Philadelphia and identify risk factors. We additionally assess the city’s progress on the goals and how this varies across neighborhoods.
Web Application
Data repository
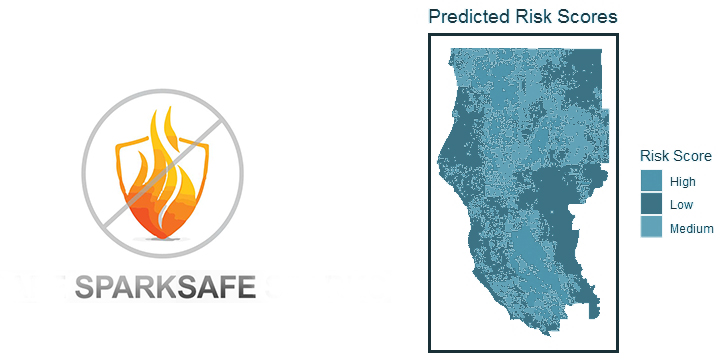
Spark Safe - A wildfire vulnerability indicator
California has more wildfires than any other U.S. state. In 2020, California saw one of the worst wildfire seasons in recorded history, and climate change could lead to even more wildfire destruction in the future (Yan et al., 2020; Miller et al., 2020). To support Cal Fire and the state of California in their important work protecting California from fire, we developed a mobile application called SparkSafe. Using the SparkSafe app, homeowners in 13 Northern California counties can enter their address and immediately learn their wildfire risk score. We used data from 2010-2017 to predict fires for 2018-2019 and then checked for its accuracy.
Marketing Sales pitch
Data repository
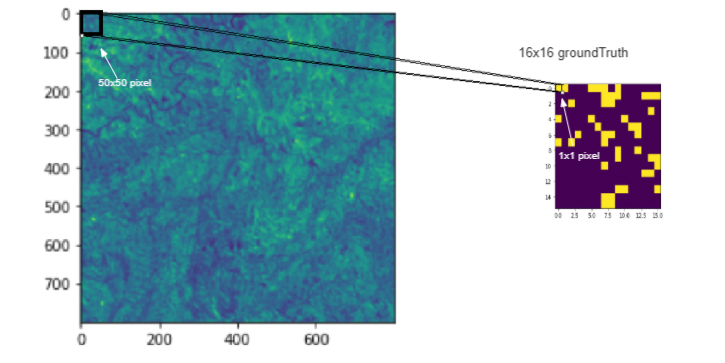
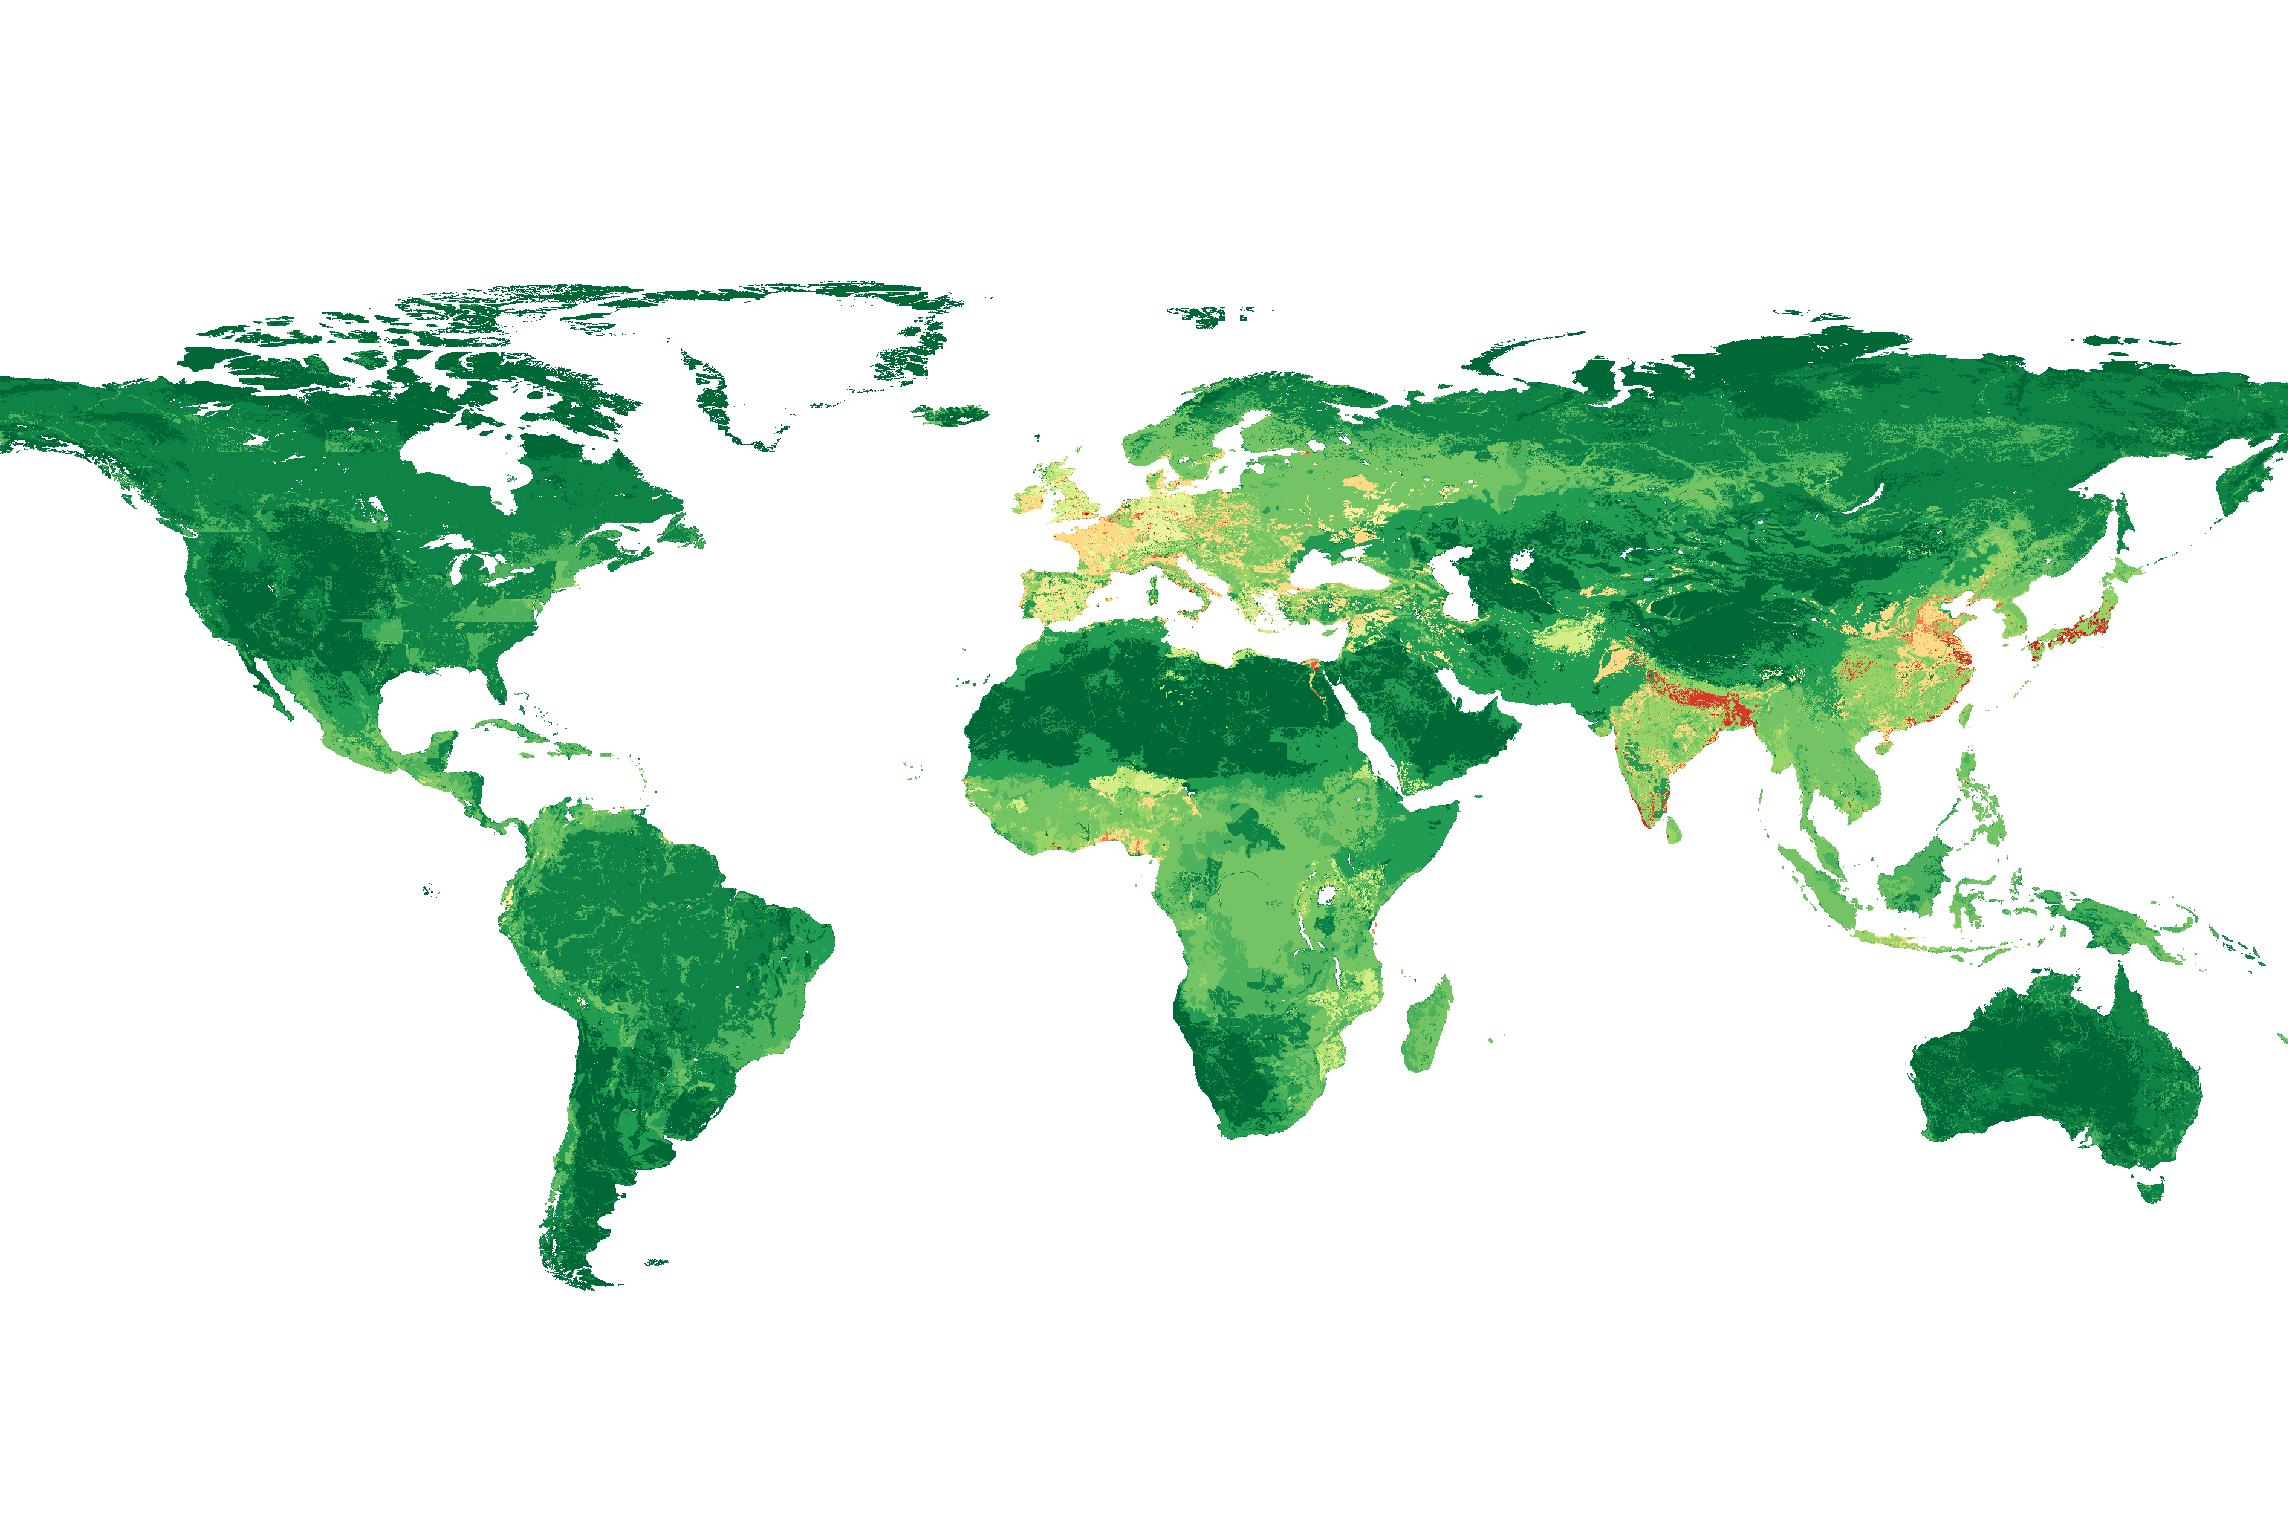
Detecting Human Settlements Lacking Electricity with Remote Sensing
Given the rate at which urbanization is occurring around the world, it is vital that new human developments have access to basic amenities such as sanitation, water, and electricity. Although these amenities are easily provided in developed countries, developing countries face enormous challenges to offering these basic resources to their citizens. In this project, we will be using satellite imagery to detect human settlements that have no electricity in order to identify where resources are needed most.
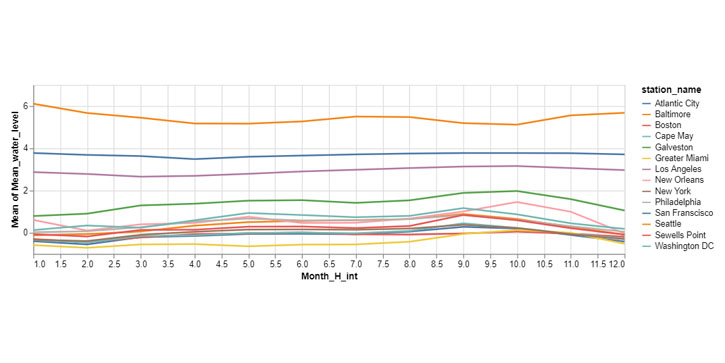
NOAA Tide Study
With climate change and the current climate scenario, understanding flooding and sea level rise patterns is of utmost important. So, I created a dashboard which visualizes and analyzes sea level rise for 16 cities across the country using historical data to predict future trends. Through understanding the technical aspects of NOAA data I learned how to visually express synthesized data into formats which are easily digestible to a variety of audiences. The disparate formats of NOAA data make understanding potential impacts of sea-level-rise and strengthening storm surges difficult for those not familiar with this type of data. I believe that Increasing the legibility of complex datasets like these help by providing a larger outreach and which in turn can help local citizens get involved in supporting policies that address it.
The below links will take you to application pages which are interactive.
![]()
![]()
![]()
Predicting Home Values for Boston using R
Zillow publishes “Zestimate” valuations for homes across the U.S. using an algorithm that draws on data from county and tax assessor records, multiple listing services, brokerages, and homeowner submissions. This project sought to improve Zillow’s housing market predictions for Miami and Miami Beach. We conceptualized our model using the hedonic model, which predicts home prices by summing the value of its constituent parts. Our model includes three types of variables: internal characteristics of houses, amenities/public services, and spatial structures.
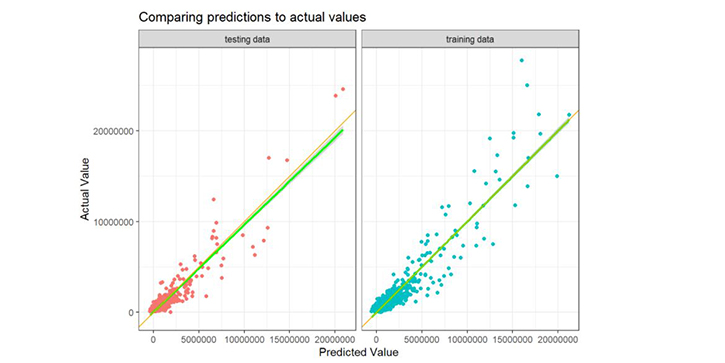
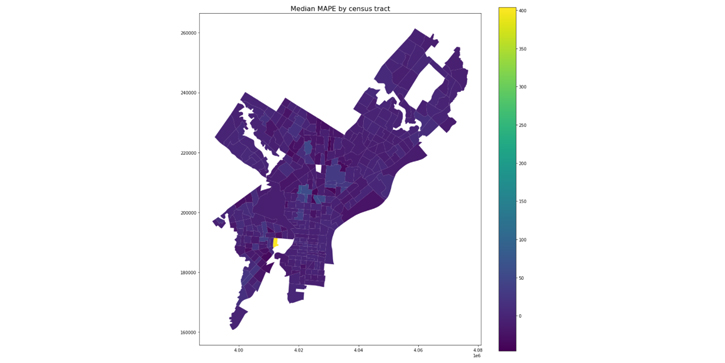
Predicting Home Values for Philadelphia using Python
Zillow publishes “Zestimate” valuations for homes across the U.S. using an algorithm that draws on data from county and tax assessor records, multiple listing services, brokerages, and homeowner submissions. This project sought to improve Zillow’s housing market predictions for Miami and Miami Beach. We conceptualized our model using the hedonic model, which predicts home prices by summing the value of its constituent parts. Our model includes three types of variables: internal characteristics of houses, amenities/public services, and spatial structures.
![]()
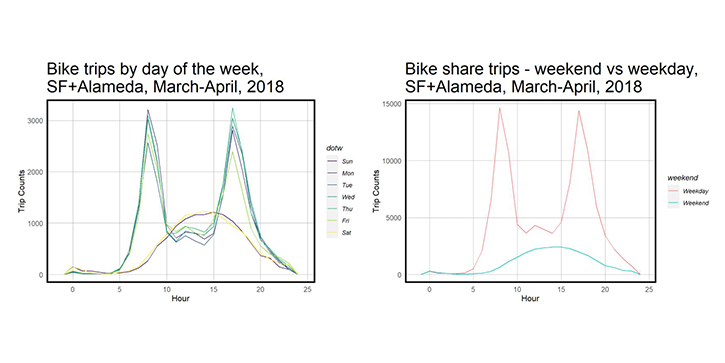
Space-Time Prediction of Bike Share Demand - San Francisco
In 2013 the San Francisco Municipal Transportation Agency partnered with public agencies to plan and implement the original Bay Area Bike Share pilot project and are now leading to work with the private sector partner to expand the system. One of the big operational challenges of bike share systems is “re-balancing” - getting bikes to stations that are anticipated to have demand but lack bikes. Figuring out how to do this is one of the keys to operating a successful system. With the introduction of the stationless bikeshare system the problem of re-balancing can be eliminated by a certain percentage. But it creates new problems as the bikes are further spread out and its harder to make sure that the bike is picked up.
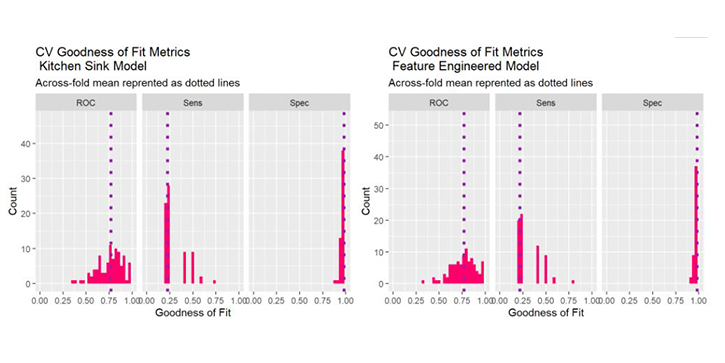
Improving HCD Tax Credit Program’s efficiency
The Department of Housing and Community Development (HCD) in Emil City seeks to launch a targeted campaign to encourage homeowners to take advantage of a $5,000 tax credit for home repairs. Typically, only 11% of the eligible homeowners they contact take the credit. This analysis attempts to improve the efficiency of HCD’s outreach effort, minimizing outreach to homeowners who are unlikely to take the credit while maximizing outreach to homeowners who are likely to take the credit. Using a random sample of HCD records, a logistic regression is developed to predict the probability that an eligible homeowner will take the home repair tax credit.
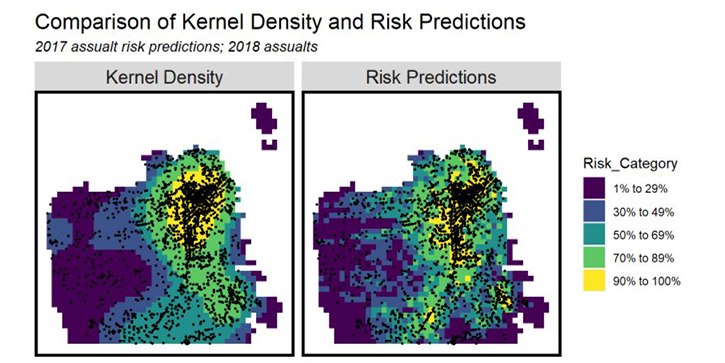
Risk Modeling - Predictive Policing
One of the main aims of policing making is to make smart and efficient decisions in terms of resource and capital allocation which benefits large populations. It is always a comparison between initial investment to long trend usage and benefits. Policing has driven public-sector machine learning because law enforcement has significant planning and resource allocation questions. Here we look at the intersection of public sector planning and data science to ensure that the supply of a limited resource matches the demand for those resources. There are many traditional methods that exist but none have been proven effective.
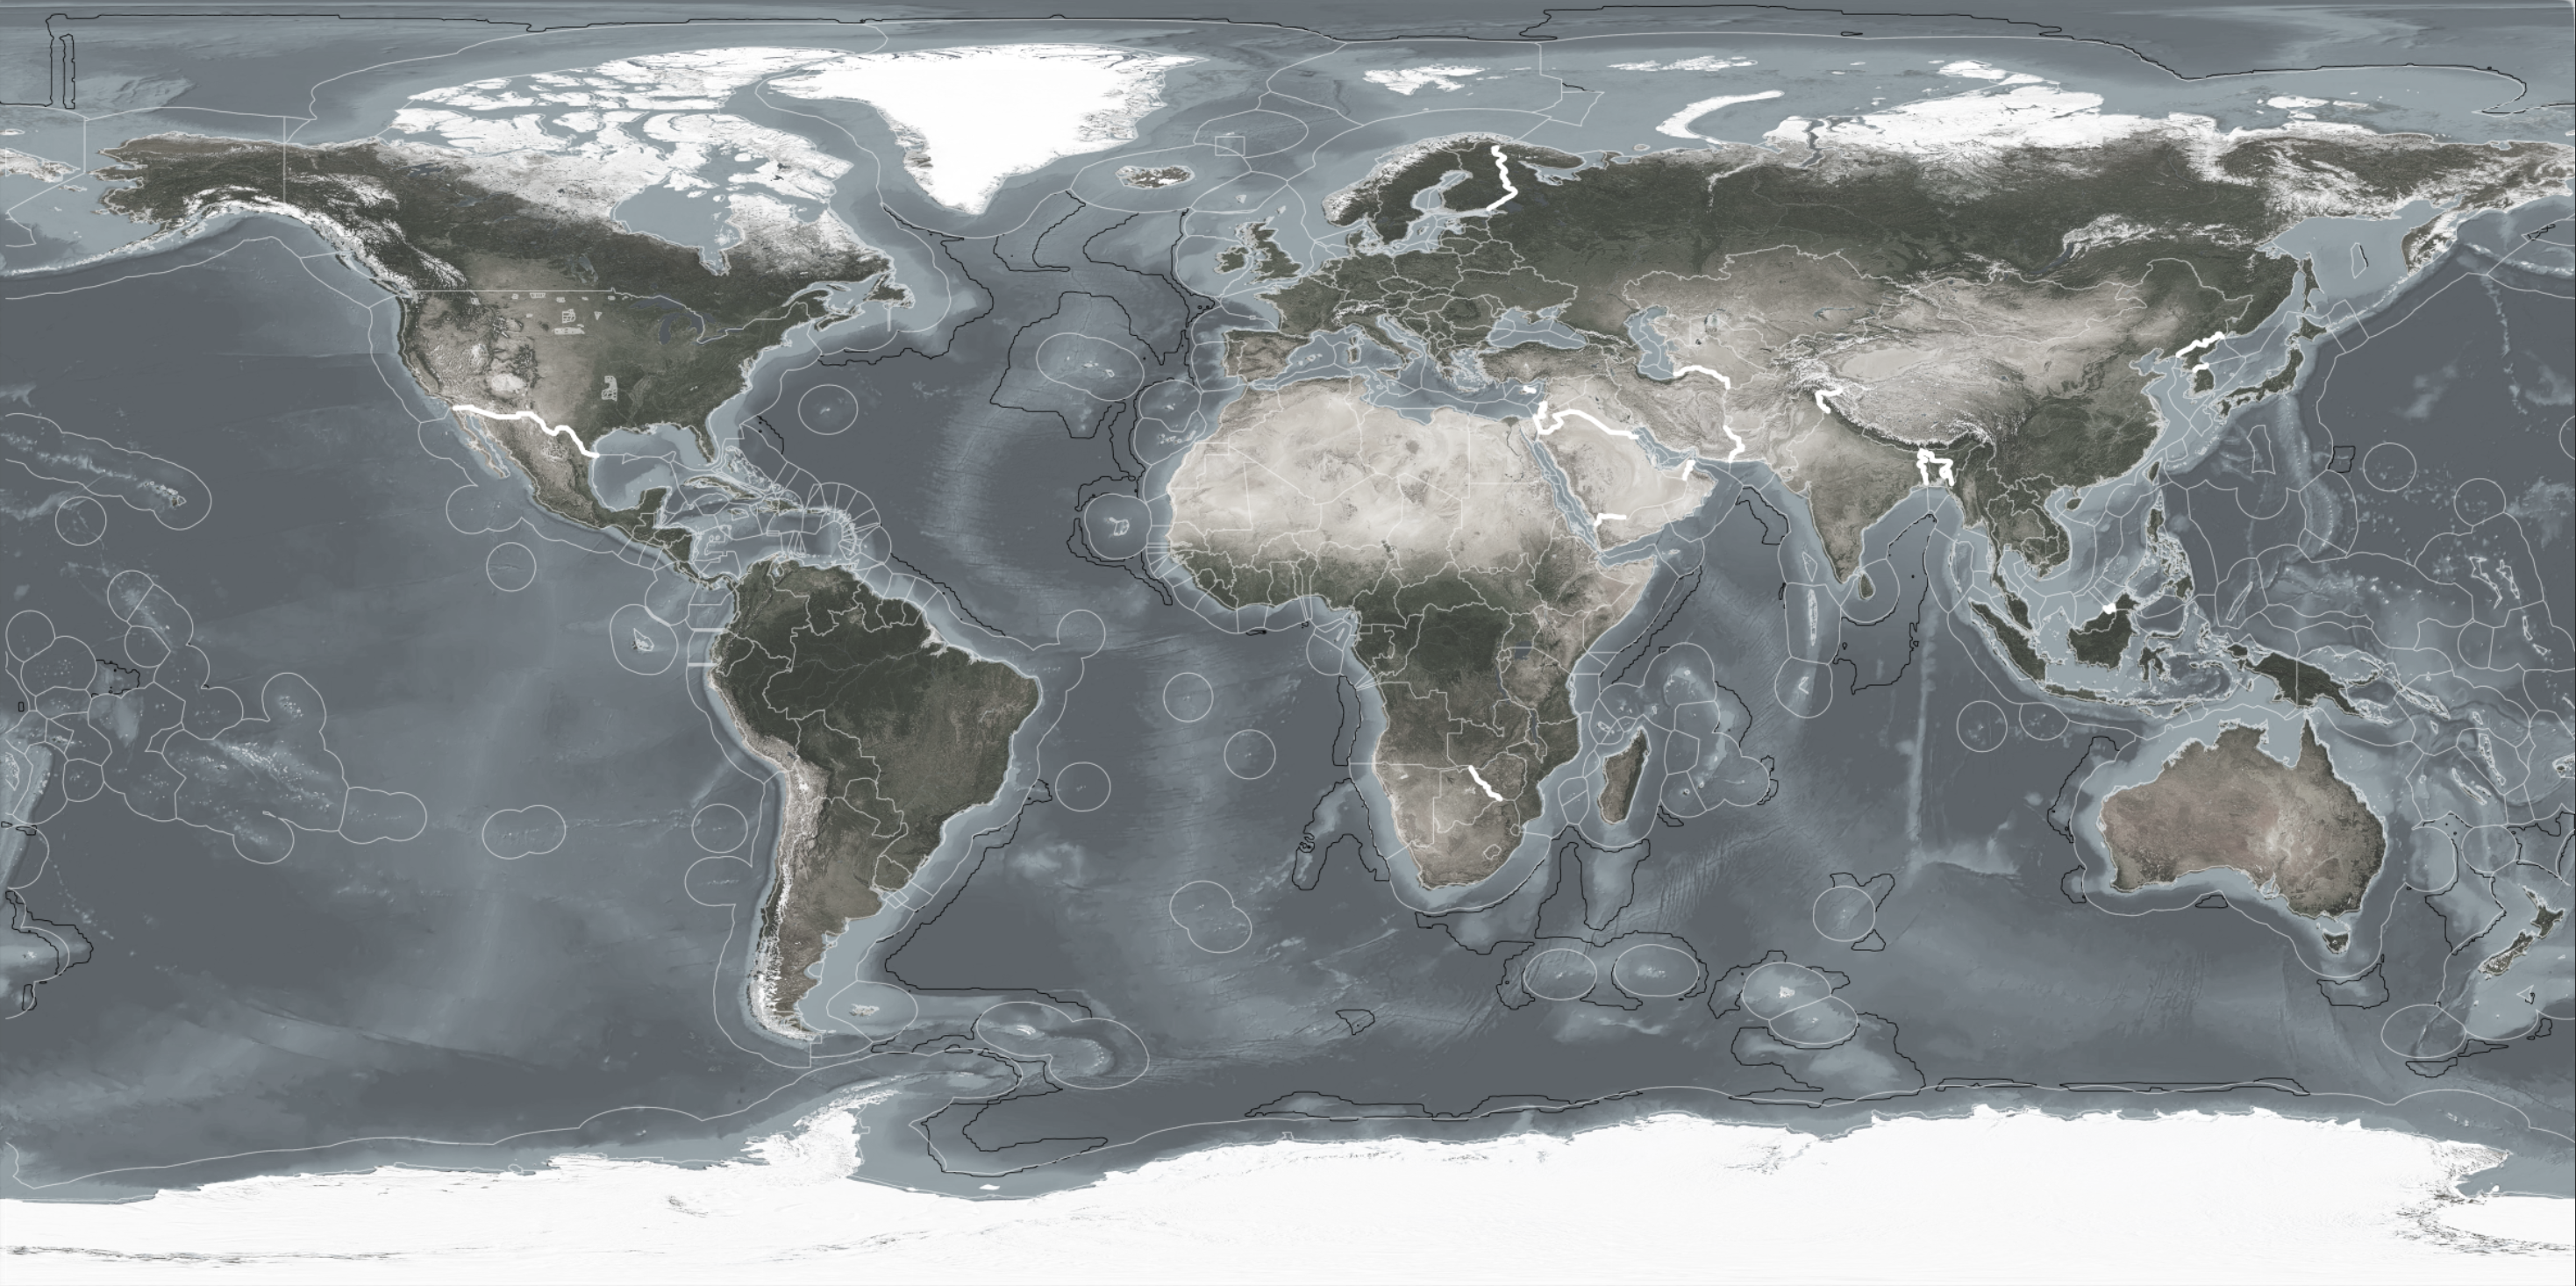
Urban Growth patterns around International Borders
When it comes to territorial disputes across the globe, the list is long and ever-changing. There are now more than 150 disputes under way that involve territory, mostly in Africa, Asia, and the Pacific region, but also in Europe and America. Many internal and external policies have contributed to this increase. The factors can be categorized in the large concepts of economic development and social development. Some cities grew as a result of increased trade between the countries while others grew because of other territorial disputes. Here I use Earth Engine and ArcGIS Python to analyze development trends around 7 borders.
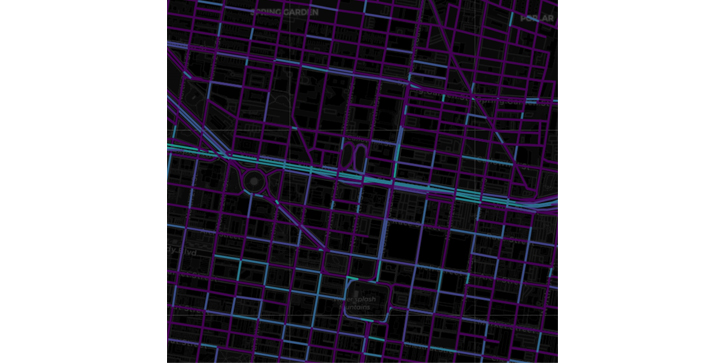
Urban Street networks
In this project, I used osmnx to analyze the crash incidence in Center City, Philadelphia. Crash data was found on PenDOT website that saves and calculates number of crashes each day. From the road networks, it was easy to identify different intersections which then were used to geolocate the crashes reported.
![]()
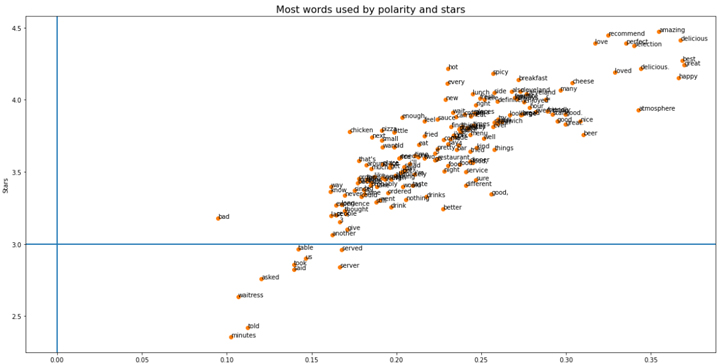
Yelp review analysis
In this project, I explored restaurant review data available through the Yelp Dataset Challenge for Cleveland. The dataset includes Yelp data for user reviews and business information for 10 metropolitan areas. I ran sentiment analysis on the reviews to check the polarity and subjectivity. Because Yelp reviews include the number of stars given by the user, the Yelp data set provides a unique opportunity to test how well our sentiment analysis works by comparing the number of stars to the polarity of reviews. Then analyzed the frequencies of different sets of words in Yelp reviews can offer insight into urban culture. Specifically, test the correlation between household income (using census data) and different types of restaurants, extracted from review data.
![]()
Design Projects
Design and analytics for me is a complex matrix composed of tangible and intangible features. I believe that enactable policies should be developed and employed across the country, reflective of the myriad spatial, social, cultural, political, and morphological agents that constitute place. Understanding the relationship between the multiplicity of actors is the key to solving many of the urban problems we face today. To find solutions that work for today and tomorrow, it is important to grasp patterns that they create, and data can help us do that.
Research Projects
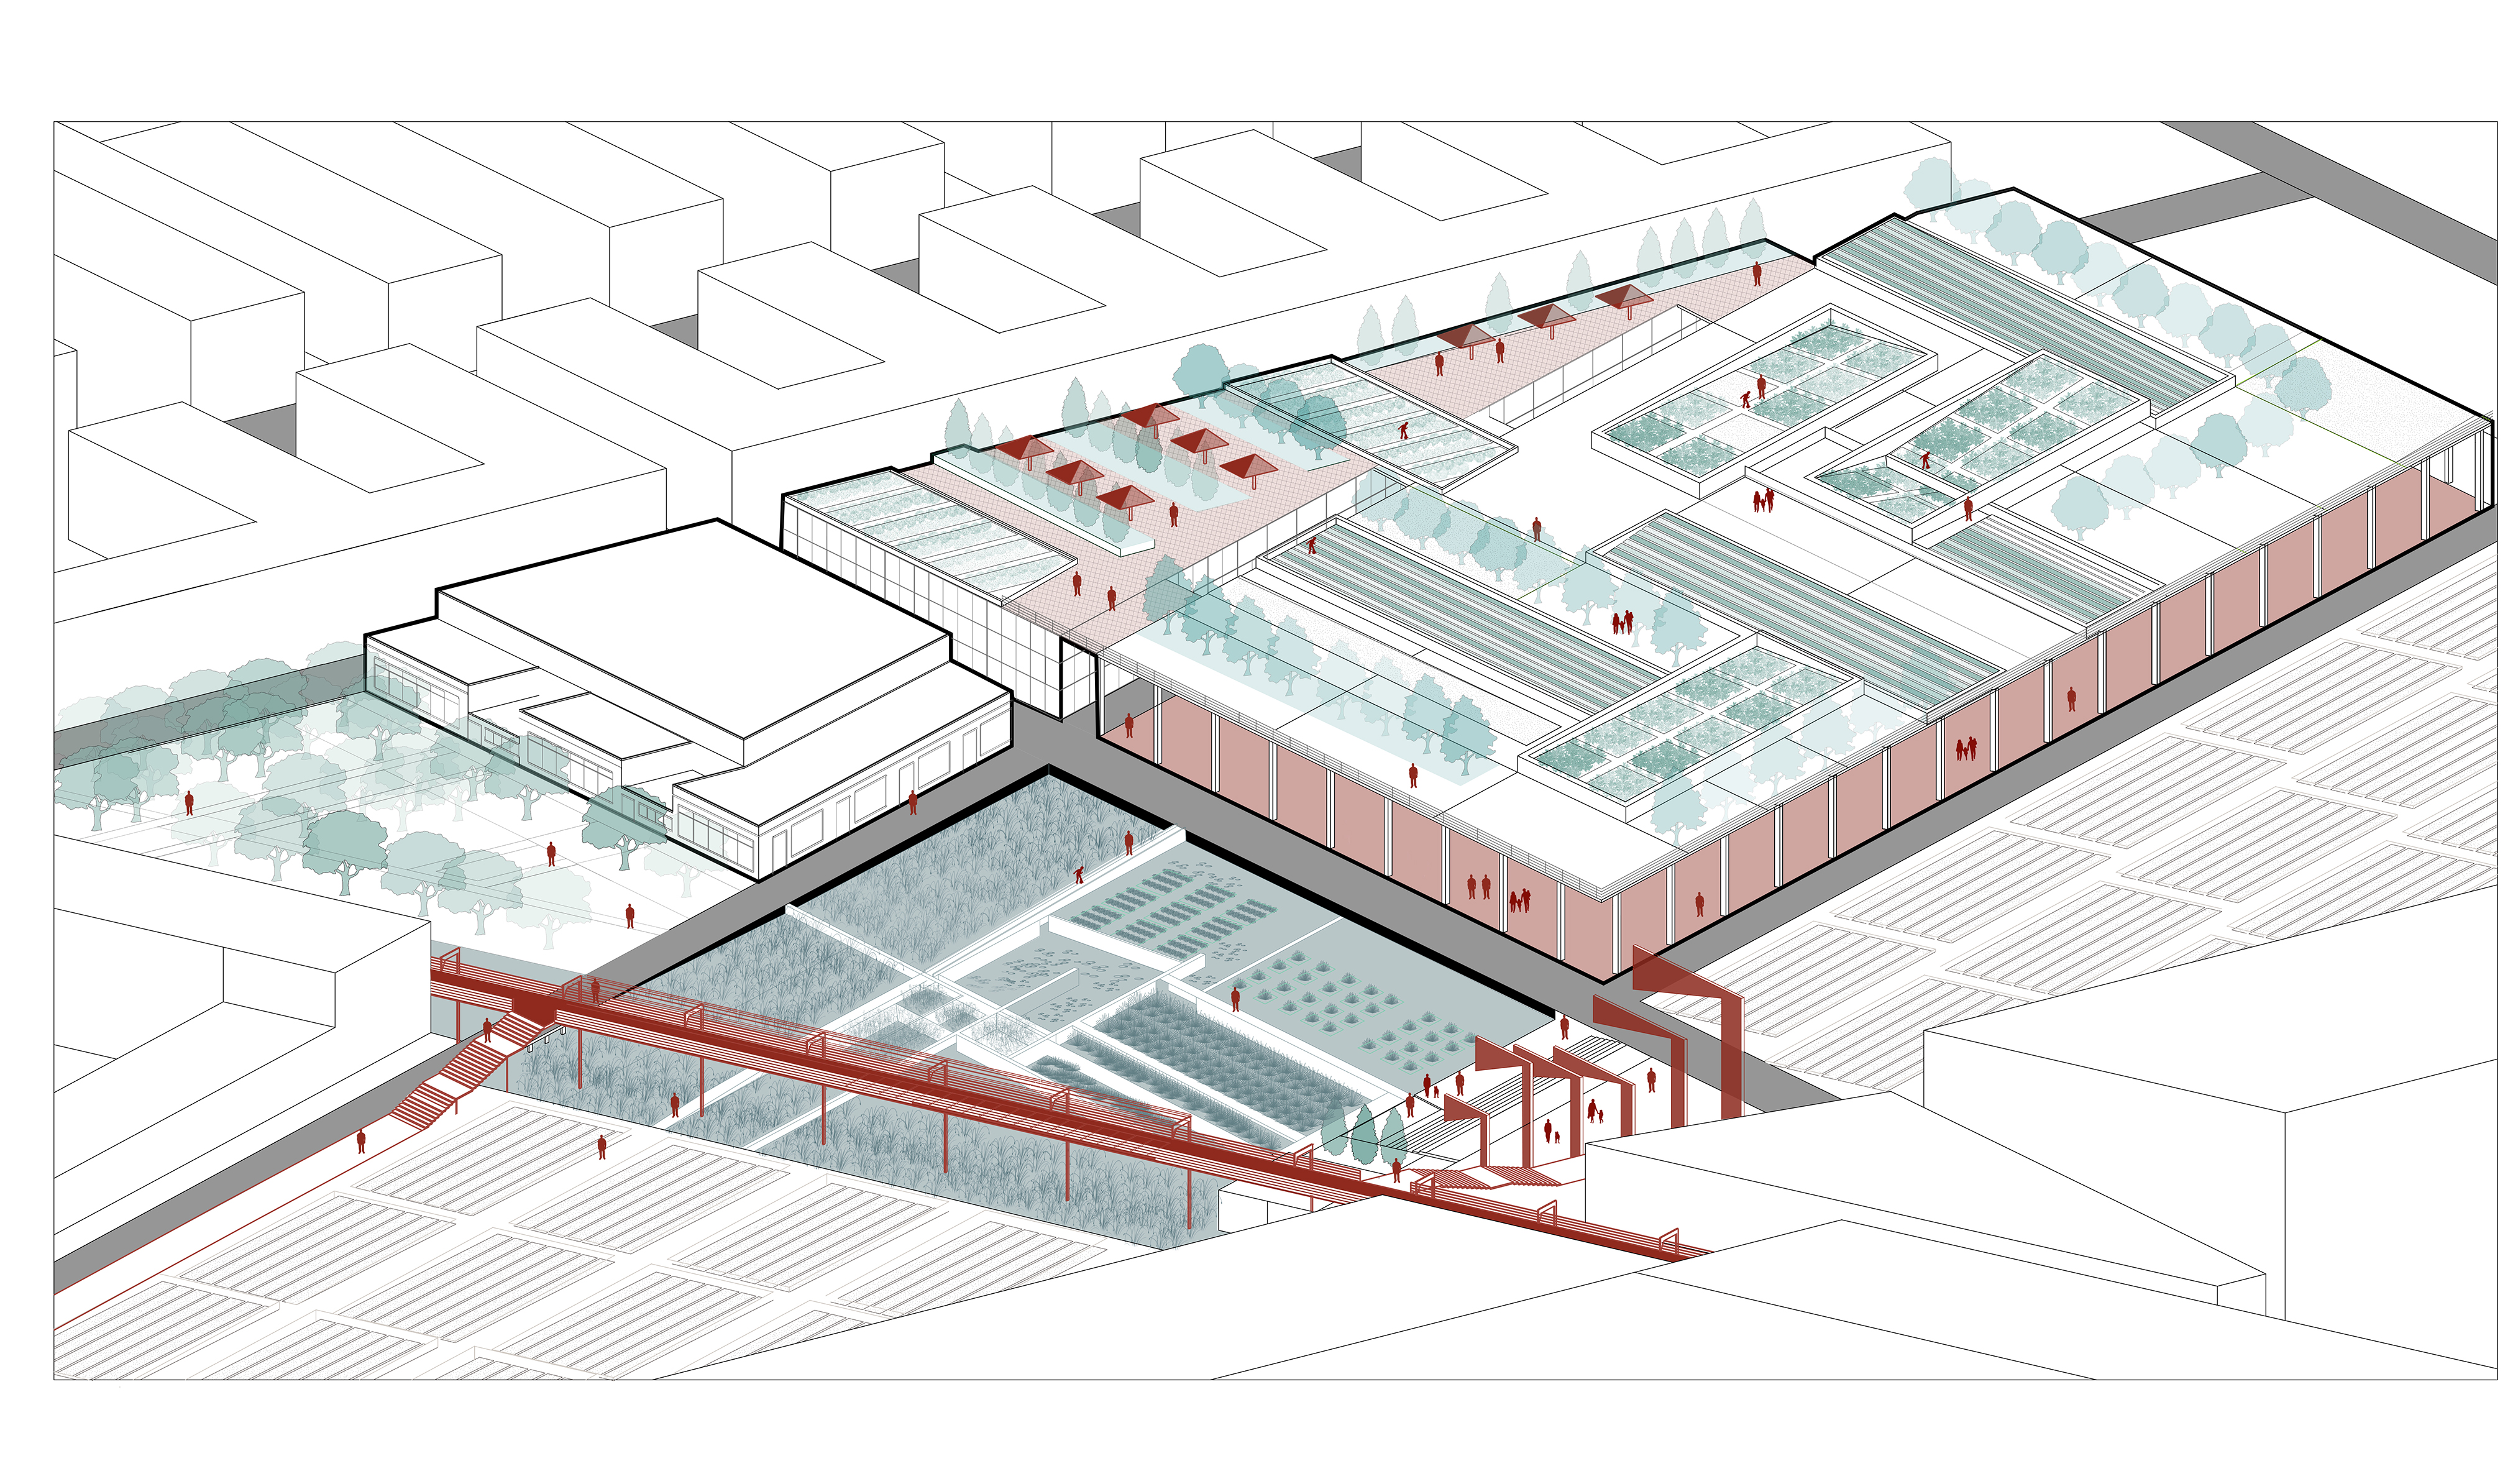
Field Notes toward an Internationalist Green New Deal
Field Notes toward an Internationalist Green New Deal is a project of the McHarg Center under the direction of Billy Fleming. Employing a variety of digital media, mapping, storytelling, and other methods, this project asks a series of critical questions about the international and justice dimensions of the Green New Deal. How might the buildout of clean energy infrastructure in the Global North reproduce exploitative relations to the Global South? How might the Green New Dealers seek to ameliorate concerns that their vision represents yet another a form of green imperialism or green capitalism? How might designers think differently about where and how they participate in the discourse around an energy transition, a just transition, and a Green New Deal?
Remote Sensing and Tangible modeling
In my research position at the Environmental Modeling Lab at the University of Pennsylvania I work intimately with satellite imagery to find spectral signatures for different kinds of systems. We utilize machine learning algorithms to train and test different images across different seasons and years. Also we work on pansharpening multi-spectral imagery and also collecting imagery from the field using drones.
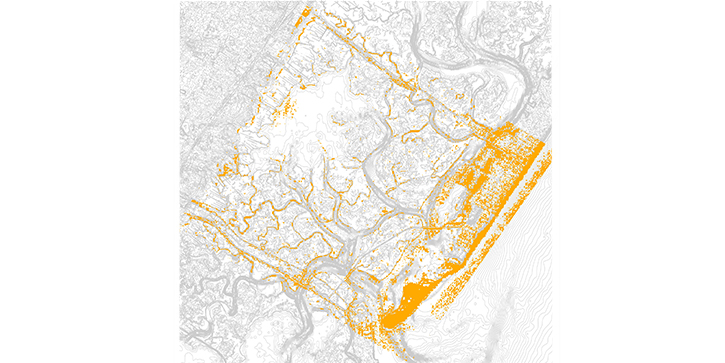
Photo credit : Jayson Latady
Skills and technical expertise
- Geospatial Analytics: ESRI GIS Software Suite (raster and vector), ArcPy, Google Earth Engine, Environmental Modeling, QGIS
- Programming Languages: R, Python, JavaScript, HTML, C++, Git, OpenStreetMaps
- Statistical Analysis: Machine learning (supervised and unsupervised), Predictive Modeling in R, Spatial Statistics
- Data Visualization: HTML/CSS, Mapbox, Carto, ArcGIS API, Adobe Suite, Seaborn, Matplotlib, Altair (Python)
- Web Development: Carto, JavaScript, Python for Web Development (panel, folium, flask)
- Satellite Imagery/ Remote Sensing: ArcGIS Spatial Analytics Toolbox, Python image processing
- Landscape Design: Land Use and Environmental Planning, Land Preservation, Urban Finance, Hydrology, Designing skills
- Environmental Science: Environmental restoration, Climate-change concepts, Ecological topics
- 3D Modeling softwares: Rhino, Sketchup, Lumion
Page template forked from evanca